Difference between revisions of "Debugger scripts"
MortenMacFly (talk | contribs) |
|||
| Line 5: | Line 5: | ||
[[image:Debuggercommand.png]] | [[image:Debuggercommand.png]] | ||
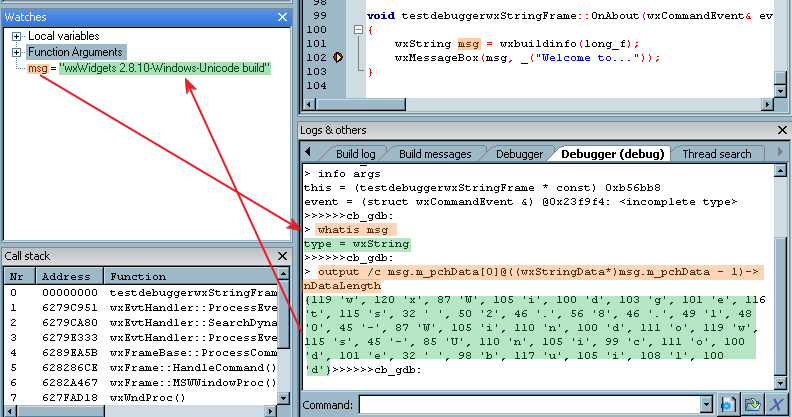
| − | Look at the image above, this will give a | + | Look at the image above, this will give a brief introduction of how the debugger script works. For example, you want to view the variable "msg". There are two handshake between the debugger plugin and gdb. |
First, the debugger plugin sends a command to gdb to query the type of msg | First, the debugger plugin sends a command to gdb to query the type of msg | ||
Latest revision as of 12:59, 12 January 2013
Basic principle of the debugger script
Look at the image above, this will give a brief introduction of how the debugger script works. For example, you want to view the variable "msg". There are two handshake between the debugger plugin and gdb.
First, the debugger plugin sends a command to gdb to query the type of msg
whatis msg
then, the gdb will return the type
type = wxString
Secondly, the debugger checks that wxString is already registered, and sends the command
output /c msg.m_pchData[0]@((wxStringData*)msg.m_pchData-1)->nDataLength
Then, gdb replies with the string below:
{119 'w', 120 'x', 87 'W', 105 'i', 100 'd', 103 'g', 101 'e', 116 't',
115 's', 32 ' ', 50 '2', 46 '.', 56 '8', 46 '.', 49 '1', 48 '0', 45 '-',
87 'W', 105 'i', 110 'n', 100 'd', 111 'o', 119 'w', 115 's', 45 '-',
85 'U', 110 'n', 105 'i', 99 'c', 111 'o', 100 'd', 101 'e', 32 ' ',
98 'b', 117 'u', 105 'i', 108 'l', 100 'd'}
Finally, the value is shown in the watch window
Script functions
Debugger scripts are similar to Visual Studio Debugger Visualizer. It allows you to write a small piece of code that gets executed by the debugger whenever you try to view a specific type of variables and can be used to show custom text with the important information you need in it.
Quote from Game_Ender - March 23, 2006
I don't think its possible to open up another window to visualize something.
Let's see how this works. Everything is inside a single file in the scripts/ folder, named gdb_types.script :). Support for more (user-defined) scripts is planned for the future.
This script is called by Code::Blocks at two places:
- when GDB is launched. It calls the script function RegisterTypes() to register all user-defined types known by the Code::Blocks' debugger.
- whenever GDB encounters your variable type, it calls the script functions specific to this datatype (registered in RegisterTypes() - more on that below).
That's the overview. Let's dissect the shipped gdb_types.script and see how it adds std::string support to GDB.
// Registers new types with driver
function RegisterTypes(driver)
{
//    signature:
//    driver.RegisterType(type_name, regex, eval_func, parse_func);

    // STL String
    driver.RegisterType(
        _T("STL String"),
        _T("[^[:alnum:]_]+string[^[:alnum:]_]*"),
        _T("Evaluate_StlString"),
        _T("Parse_StlString")
    );
}
The "driver" parameter is the debugger driver but you don't need to care about it :) (currently this only works with GDB). This class contains a single method: RegisterType. Here's its C++ declaration:
void GDB_driver::RegisterType(const wxString& name, const wxString& regex, const wxString& eval_func, const wxString& parse_func)
So, in the above script code, the "STL String" (just a name - doesn't matter what) type is registered, providing a regular expression string for the debugger plugin to match against and, finally, it provides the names of the two mandatory functions needed for each registered type:
- evaluation function: this must return a command understood by the actual debugger (GDB in this case). For the "STL string", the evaluate function returns an GDB "output" command which will be executed by the GDB debugger.
- parser function: once the debugger runs the command returned by the evaluation function, it passes its result to this function for further processing. What this function returns, is what is actually diplayed by CodeBlocks (usually in the watches window or in a tooltip).
Let's see the evaluation function for std::string:
function Evaluate_StlString(type, a_str, start, count)
{
    local oper = _T(".");

    if (type.Find(_T("*")) > 0)
        oper = _T("->");

    local result = _T("output ") + a_str + oper + _T("c_str()[") + start + _T("]@");
    if (count != 0)
        result = result + count;
    else
        result = result + a_str + oper + _T("size()");
    return result;
}
I 'm not going to explain what this function returns. I 'll just tell you that it returns a GDB command that will make GDB print the actual std::string's contents. Yes, you need to know your debugger and its commands before you try to extend it.
What I will tell you though, is what those function arguments are.
- type: the datatype, e.g. "char*", "const string", etc.
- a_str: the name of the variable GDB is trying to evaluate.
- start: the start offset (used for arrays).
- count: the count starting from the start offset (used for arrays).
Let's see the relevant parser function now:
function Parse_StlString(a_str, start)
{
    // nothing needs to be done
    return a_str;
}
- a_str: the returned string when GDB ran the command returned by the evaluation function. In the case of std::string, it's the contents of the string.
- start: the start offset (used for arrays).
Well, in this example, nothing needs to be done. "a_str" already contains the std:string's contents so we just return it :)
I suggest you study how wxString is registered in that same file, as a more complex example.
Links
- [/index.php/topic,11184.msg76200.html#msg76200 Debugging QString]
