Difference between revisions of "Debugging with Code::Blocks"
m |
MortenMacFly (talk | contribs) m (Explain, why -g) |
||
| Line 1: | Line 1: | ||
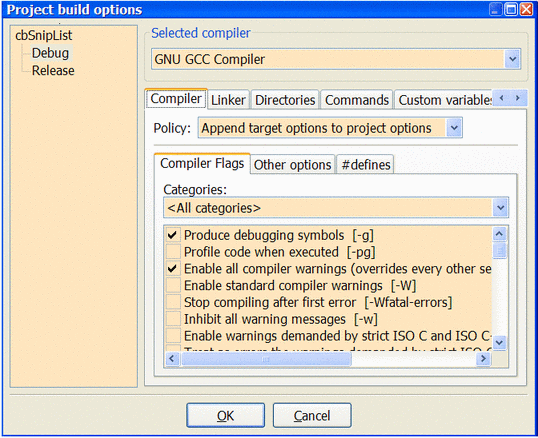
| − | Make sure that the project is compiled with the -g compiler option. | + | Make sure that the project is compiled with the -g compiler option. This ensures that the executable has debug symbols included. Please notice that for other compilers than GCC this might be a different switch. |
Menu => Project => Build Options | Menu => Project => Build Options | ||
Revision as of 06:42, 26 October 2006
Make sure that the project is compiled with the -g compiler option. This ensures that the executable has debug symbols included. Please notice that for other compilers than GCC this might be a different switch.
Menu => Project => Build Options

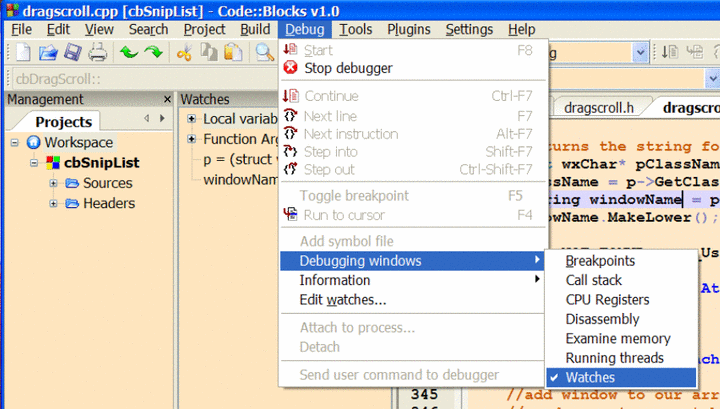
Open The Debugger Watches Window
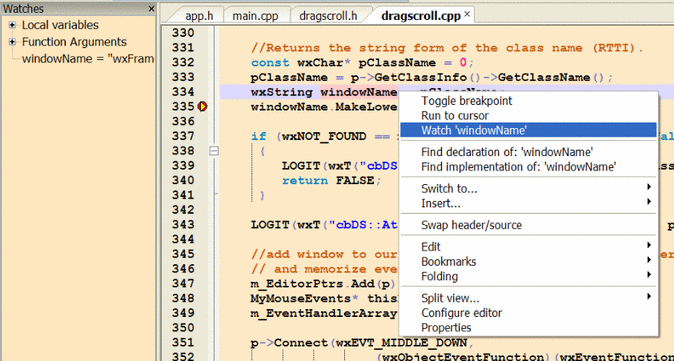
Find the line containing the variable to be watched. Set a breakpoint in a position that will allow you to observe the variable value.
Menu => Debug => Toggle Breakpoint

Run the debugger until the breakpoint is reached. Right click the variable to set a watch in the Watch Window.
Notes:
Breakpoints may also be toggled with a left click in the left editor margin.
Breakpoints do not work in constructors or destructors. They do, however, work in routines called from them. This is a GDB restriction, not a bug.
