Debugging with Code::Blocks
Build debug version of your project
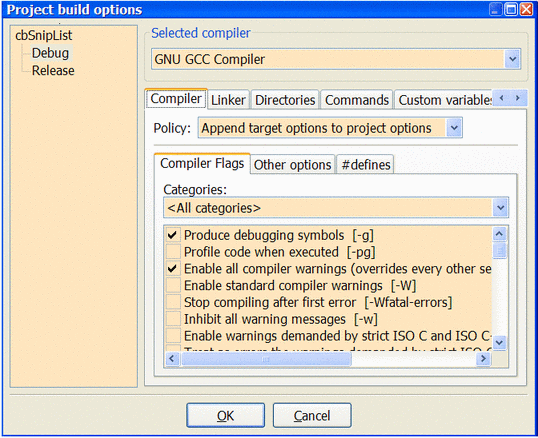
Make sure that the project is compiled with the -g (debugging symbols) compiler option on, and the -s (strip symbols) option off. This ensures that the executable has debug symbols included.
Compiler optimization switches should be turned off, stripping symbols (-s) must be turned off.
Keep in mind that you may have to re-build your project as up-to-date object files might not be re-compiled with -g otherwise. Please be aware that in compilers other than GCC, -g and/or -s might be a different switch (-s might not be available at all).
Menu => Project => Build Options
Add Watches
In version 10.05
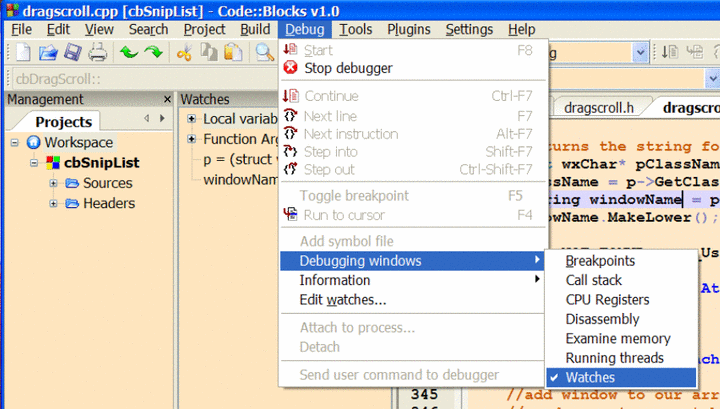
Open The Debugger Watches Window
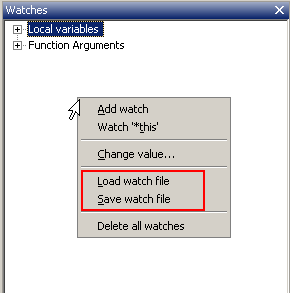
The list of watches can be saved to a file and later re-loaded. To do so, right click in the list of watches and select "save watch file" (and "load watch file" to re-load them again).
In 12.11 or latest nightly builds
In the latest nightly builds the watches window has been redesigned and works differently that the one in 10.05.
Currently there are three ways of adding watches in it:
- Click in the empty last row in the watches window, type the name of the variable (or full expression) and hit enter.
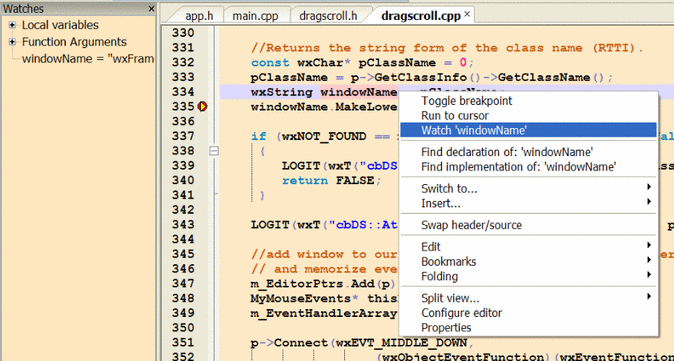
- While the debugger has stopped on a breakpoint select a variable name or full expression, right click to open the context menu and then select "Add watch 'expression'".
- Select an expression in the editor and drag'n'drop it in the watches window.
The automatic inclusion of local variables and function arguments have being reimplemented in 13.12.
Double-clicking in the Call stack window
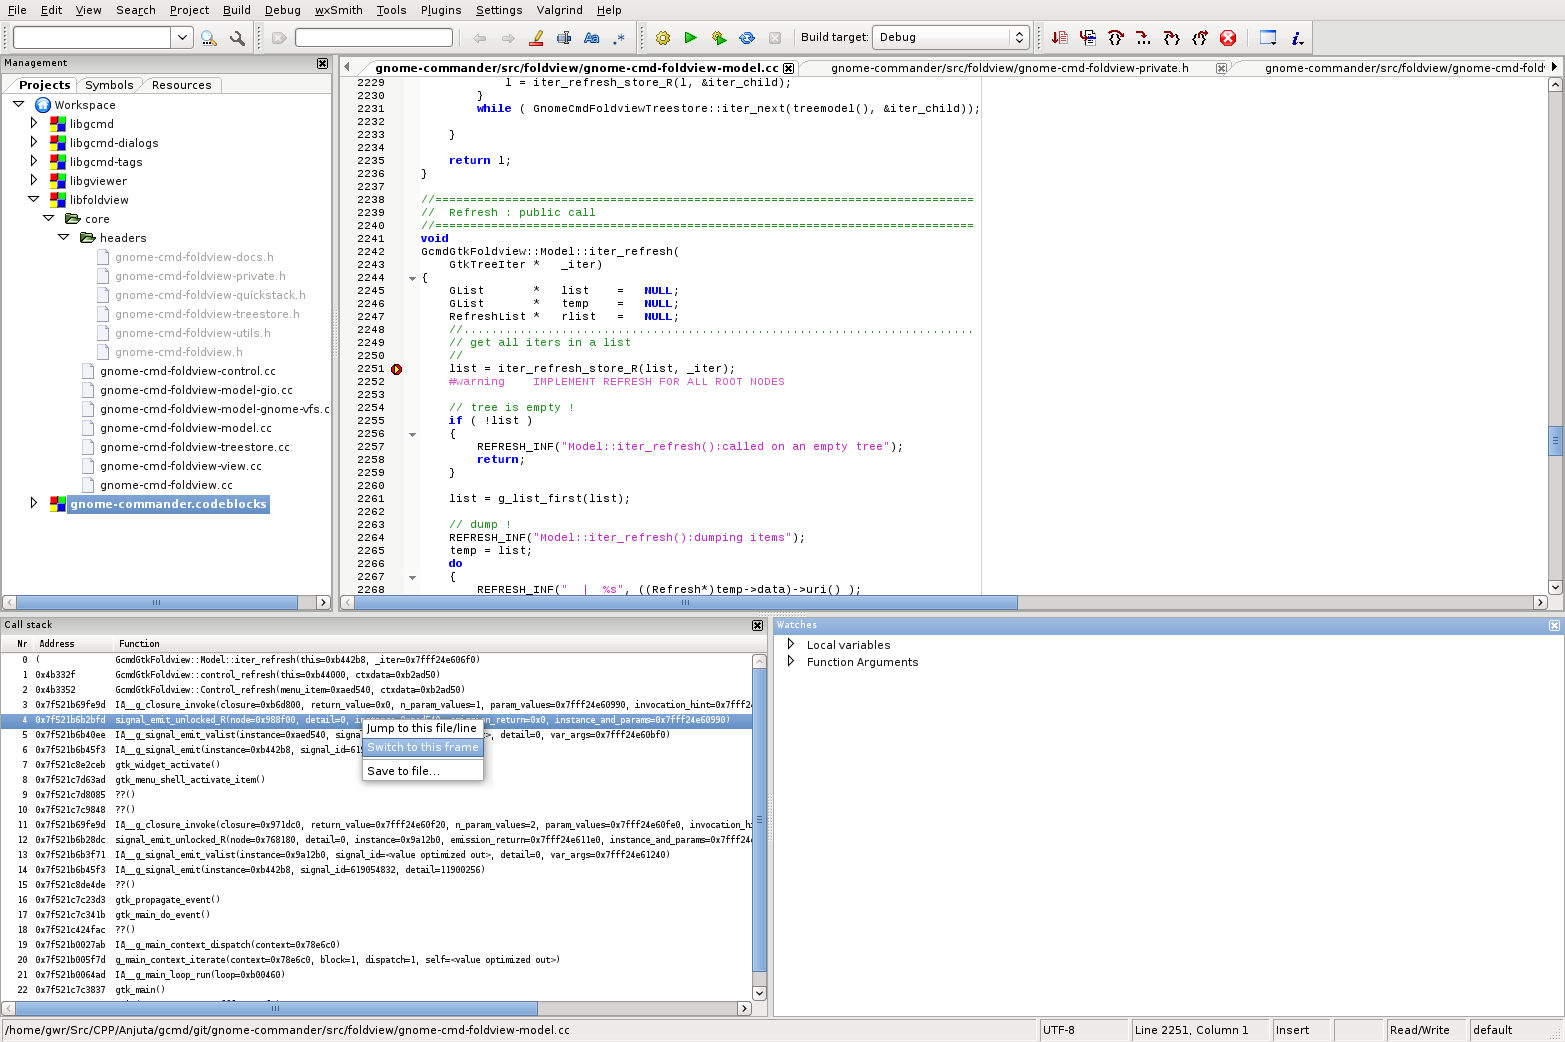
Note : when debugging, double-clicking on a frame in the "call stack" debug window does not automatically update the variables displayed in the "watches" debug window.
You have to right-click on a frame in the "call stack" debug window and select "Switch to this frame".
Set Breakpoints
Find the line containing the variable to be watched. Set a breakpoint in a position that will allow you to observe the variable value.
Menu => Debug => Toggle Breakpoint
Run the debugger until the breakpoint is reached. Right click the variable to set a watch in the Watch Window.
Breakpoints may also be toggled with a left click in the left editor margin.
Notes
Script support
Code::Blocks natively use squirrel script language to deal with gdb, see: Debugger scripts. As gdb 7.x support python pretty printer, so, it can also use gdb(with python support) to show some complex variable values. see forum thread [/index.php/topic,11301.msg77000.html#msg77000 unofficial MinGW GDB gdb with python released] and Use GDB python under Codeblocks for more details.
Single file debugging
To debug your program you need to setup a project. Single file programs are not supported.
Path with spaces
Breakpoints could not work if the path/folder you've placed your project contains spaces or other special characters. To be safe use English letters, digits and '_'.
Forking
If your application uses the 'fork' system call you'll have trouble stopping the debugged program or setting breakpoints on the fly. Here is a link explaining the forking modes of GDB: http://sourceware.org/gdb/onlinedocs/gdb/Forks.html
Update to the newest version of MinGW
From gdb 6.8 released on April 2008, it supports many features which does not exist in early versions. You can update by installing binaries from TDM-Mingw package.
Use 32bit CDB for 32bit programs and 64bit CDB for 64bit programs
It seems that debugging a 32bit program with 64bit CDB doesn't work on Windows 7, but 32bit CDB works perfectly.
Note: This should no longer be the case with Code::Blocks' rev>=10920. See the ticket for details: #429
Limits on the early version of MinGW
If your are still using the MinGW and gdb 6.7 from 8.02 setup files, setting breakpoints in the constructor will not work. Here are some tricks.
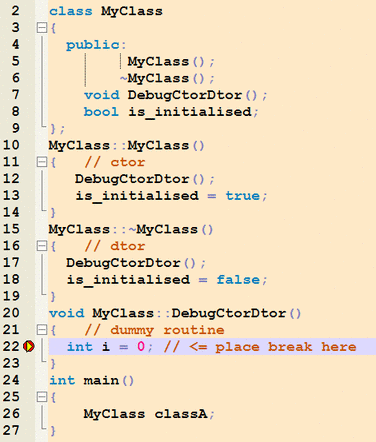
Breakpoints do not work in constructors or destructors in GDB 6.7 and earlier version. They do, however, work in routines called from them. This is an early GDB restriction, not a bug. So you could do something like:
...and place a breakpoint in "DebugCtorDtor" at the line "int i = 0;" . The debugger will break at that line. If you then step the debugger (Menu Debug => Next Line; or alternatively F7) you'll reach the code in the constructor/destructor ("is_initialized = true/false;").
